Argo BV
monitoring ocean environments with floats and APIs
Making a Streamlit app which interacts with Argo data APIs to retrieve queried data and plot regional and temporal statistics.
Using the App
- Enter the Latitude and Longitude ranges on the left-hand panel. Click Update Region to draw data on map.
- Select the profile acquisition date range
- Select the depth range of data points to retrieve
- Select the Get Data! button to retrieve and process data from Argo servers
- Adjust the temporal ranges of data to plot, along with plotting options for BV profiles
Argo: Big Data Oceanography
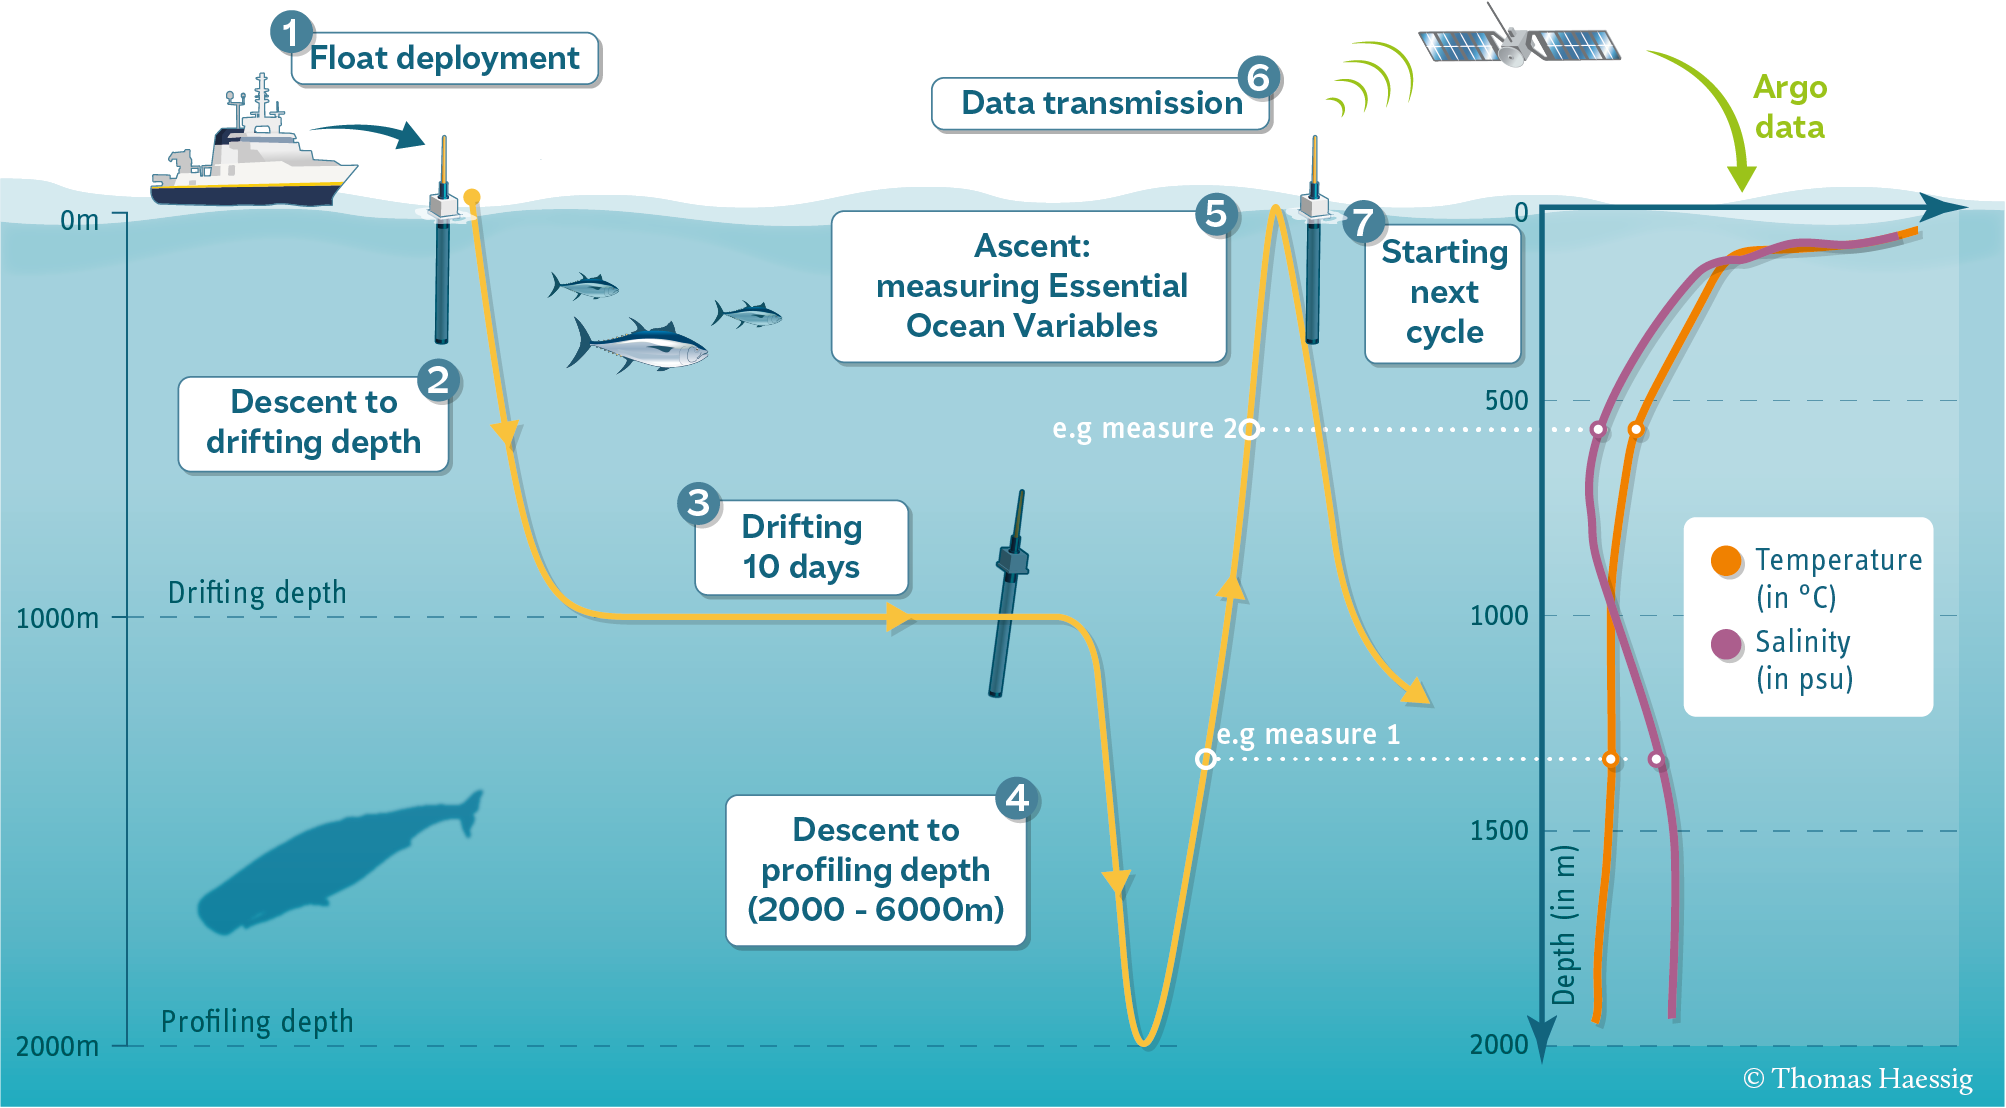
Over the past twenty years, the Argo program has revolutionized oceanography by deploying thousands of robotic measuring devices known as `floats’ across the world. These floats spend most of their time submerged, drifting with the ocean currents. About once a week, a float will change its bouyancy and slowly ascend to surface. During the ascent, measurements of the local pressure, temperatue, salinity and other variables are taken. At the end of the ascent, the float breaches the ocean surface and transmits data to a satellite. Feeling accomplished, the float descends to a depth of around 1km and the process begins again.

Each cycle produces a one dimensional slice of the ocean known as a profile. Over the course of the Argo program, there have been over two million profiles acquired. Every day, approximately 400 profiles are added to this number. The scale of this data, and the number of scientists who rely upon it, requires standardized means of storage and access. A benefit of this standardization is that data retrieval, processing, and analysis can be automated. This project is a prototype of how this workflow can be turned into an app for interactive data exploration. A lot of this process is already taken care of by the great python library argopy, which is a python library which takes care of requesting and retrieving data from the appropriate server.
Brunt-Väisälä frequency
I decided to calculate the Brunt-Väisälä (BV) frequency profile from the Argo data and allow the user to interactively see how the profile changes with region and time of year. But what is the BV frequency? In the ocean, density will vary with depth since water is both compressible and its contents (like salinity) and properties (like temperature) change. When ocean currents or an external force disturbs the density versus depth relationship, relatively dense water is shifted upwards and relatively light water is shifted downwards. Gravity then acts as a restoring force, pulling the denser water downwards and the lighter water upwards. The physics is similar to simple harmonic motion, where the density gradient is analogous to the spring constant. Just like harmonic motion, the frequency of oscillation can be determined from the strength of the restoring force. This frequency of oscillation is known as the Brunt-Väisälä (BV) frequency. It is a critical parameter in ocean circulation and is a proxy for the local stability of the water column. BV profiles in the ocean are dependent on a large number of parameters, many of which vary of the course of the year as the mixing from winds, heating from the sun, and local ocean currents change.
Building The App
To build the app, the first step is to understand the flow of data to the web app. First, profiles are collected with Argo floats and then transmitted to Iridium satellites. Then those satellites transfer the data to French ERDAP servers where the data is stored. The data is publicly available from these servers via a REST API. Argopy is a handy python library which handles the API syntax and data formatting, where a DataFetcher object returns the queried profiles as an xarray dataset. The profiles are then analyzed and plotted with the streamlit app. The streamlit app can also adjust the values of the argopy query, and therefore change what data is plotted on the web app.

The app is built using the streamlit python library, which allows you to build web apps for machine learning and data science. The main component of a streamlit web app is a python script which gets updated each time the user interacts with the web app. Streamlit has several useful functions for creating user interfaces, such as the box for the user to input a number or a slider to select a date range. Additionally, plots can be directly called within the python script and will be rendered in app. This allows for quick iteration and the ability to make web apps with little knowledge of web programming. An important feature of streamlit which is essential for creating the app is use of their cache and session state. These features allow information to shared between runs of the python script, which is necessary to keep track of user input and data retrieved with argopy.
